
Section 1.2 Your Business Plan
Objectives
Use the algebraic model of a data set to interpolate and extrapolate from the data.
Use a compound interest model to determine present value of an investment.
Make, and effectively communicate to both technical and non-technical audiences, a business decision on the basis of conclusions drawn from algebraic models of data.
Worksheet 1.2.1 Decision Report 2: Profit Scenarios
In Decision Report 1: What's My Lane? you identified a marketing opportunity for a product whose demand could be correlated to an unexpected factor outside of the market. To complete your business plan, you'll need to show investors when they can expect your business to become profitable, and what return they can expect on their investment.
1.
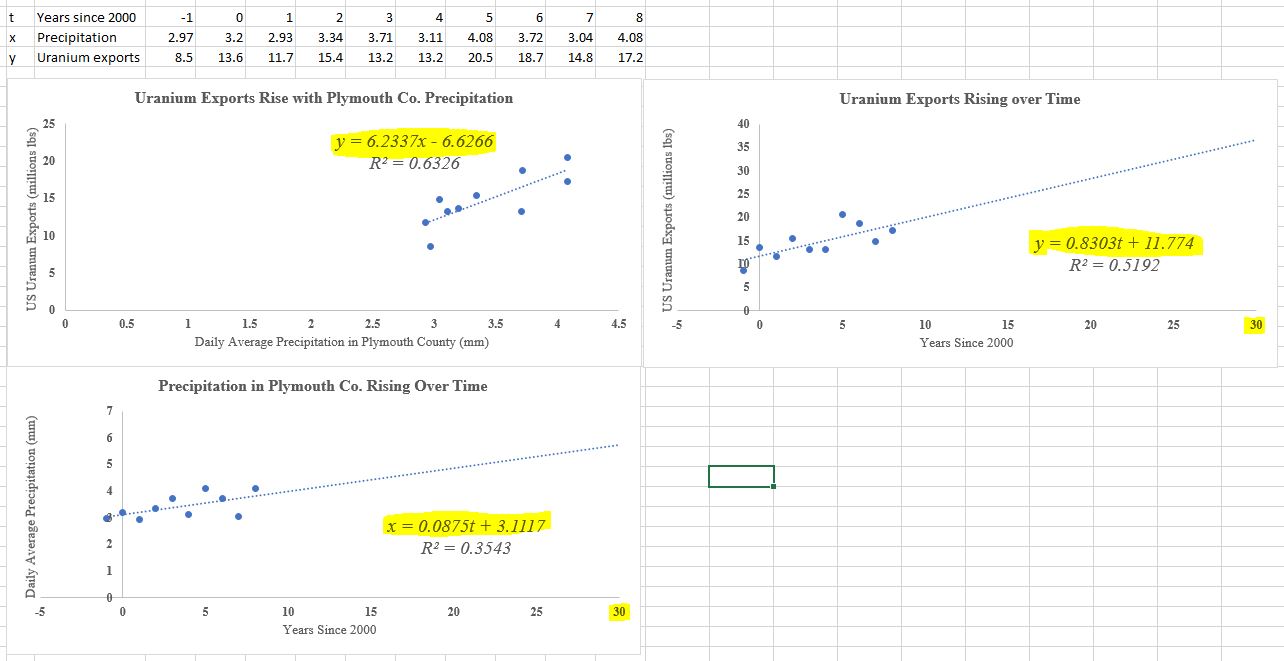
Return to your Excel workbook from Decision Report 1: What's My Lane?. Create two new scatter plots and linear regression trend lines: one each for
Your correlated quantity vs. time (\(x\) vs. \(t\)).
Your target quantity vs. time (\(y\) vs. \(t\)).
You should end up with three plots, and three regression equations, in total.
2.
You are privately hoping that your product will be profitable in the year 2025. Using the equation for your \(y\)-versus-\(t\) function model, determine how many units of your product you would expect to be selling in the year 2025.
3.
Using the equation for your \(y\)-versus-\(x\) function model (the equation you found in Worksheet Exercise 1.1.1.5), determine the value of the correlated quantity \(x\) when you will have reached your target quantity from (1.2.1).
4.
Using the equation for your \(x\)-versus-\(t\) function model, determine in which year the time-series model predicts the correlated quantity will reach its target from (1.2.2).
5.
The prediction made in the previous step might not be the same as the 2025 you're hoping for. Why do you think that is? Which is the “best-case” scenario for your business plan, and which is the “worst-case” scenario?
6.
Decide how much venture capital you'll be asking investors for in your business plan. Explain how you decided on this number, referencing the costs of the product you plan to sell. (Don't sweat these details too much for our course. We mainly just need a number.)
7.
Your venture capital investors will want a return on their investment of at least 25% per year. Determine the total amount of returns they would be expecting over the ten-year period from 2020 to 2030 under this scenario.
8.
Suppose you were to return this amount to them in a single installment in 2030. Using current rates of inflation and a compound interest formula, determine the value of this money in today's (2020) dollars.
9.
Finally, turn your responses to these questions and Decision Report 1: What's My Lane? into a single writeup of your business plan. Your writeup should be a maximum of two pages, single-spaced, not including any graphs or tables, and should not include question numbers. Your readers should be able to understand your plan without seeing this worksheet of questions.
Be sure that your final plan:
Includes brief summaries of the key elements of a business plan.
Gives readers both the best- and worst-case scenarios for your dates of profitability, and how the “correlated” quantity (\(x\)) will tell them when that profitability date has arrived.
Includes both the technical details of the computations (algebra) you made in this activity, and all written reasoning, graphs, and data tables that support your plan.