
Earlier this month, I did a preliminary assessment of Andrew Torrez’s speculation on the Opening Arguments podcast that the Roberts Court has ushered in a new era of polarization on the U.S. Supreme Court. The answer, looking at 20 years of history, seemed to be no. A wider view of 75 years of history, meanwhile, suggests the answer is… still no. The Roberts Court is not significantly more polarized in its merit case votes than any other Court in this history.
But, the data suggest two interesting trends in Supreme Court unanimity over the past 75 years: a steady boom-and-bust cycle about every decade, and a significant Roberts Court uptick in the second derivative suggesting that year-over-year, the consensus about consensus may be disappearing.
Framing the Question
The recent acceleration in U.S. political and ideological polarization has heightened voters’ sensitivity to consensus — or lack thereof — in our political discourse. So it’s only natural to ask whether the U.S. Supreme Court, whose perception as apolitical is rapidly evaporating, is becoming increasingly polarized in its decision-making. Have the Roberts Court’s four conservative-bloc justices (Alito, Gorsuch, Kavanaugh, Thomas) and four liberal-bloc justices (Ginsburg, Sotomayor, Breyer, Souter) been likely to retreat to their ideological corners in the Court’s decisions? Has there been, as Torrez suspects, a significant increase in split-decision opinions (such as 5-4) and decrease in unanimity? Are the justices as unlikely to find agreement on the politically charged issues of the day as is the rest of our political class?
Torrez can be forgiven for suspecting so – and I wonder if one reason for it is an availability heuristic bias. The Court, on average, makes between 80–90 decisions on merits each year, and many of these do not make national news. Those that do make news, though, are those most hotly contested along ideological lines. Whole Women’s Health. Obergefell. Citizens United. Of course Bush v. Gore. Besides having hot political and public controversy in common, these decisions also have in common that only five justices voted with the majority. In other words, it might feel like there are more split decisions because so many of the first decisions that come to our mind were split.
To test whether there is more to this suspicion than an availability effect, I wanted to look at a data set of Court decisions as far back into history as I could find (without straining my fall sabbatical). The indispensable SCOTUSBlog has compiled “stat pack” reports on each Supreme Court term since 1995, and my preliminary analysis used data from their reports, having roughly ten years’ each of data from the Rehnquist and Roberts courts.
Then, as I will now, I operationalized “polarization” using the number of dissenting votes as a proxy. Naturally, with a maximum of nine justices voting, this number of dissents ranges from 0 to 4, with zero serving as my marker of “unanimity” or consensus and four as the maximum level of “polarization” or dissent. Most Court decisions have nine voting justices, though a few have fewer, for various reasons — I chose not to compensate for this effect since the number of cases with fewer than nine votes is relatively small.
That preliminary analysis did not turn up evidence that polarization had increased in a significant way in the ten years after Roberts became chief justice relative to the ten years before.
But I wasn’t satisfied with only ten years on either side. I want to know how the Roberts Court stacks up against the rest of the 20th century. So I reached for a larger data set, clued in by a commenter on my previous post. (Thanks to you, commenter!)
Well – to be honest I didn’t follow his advice at first. Instead I used my institutional membership in the wonderful ICPSR database to locate what, in the years before the internet, was probably the definitive data set on the Supreme Court:
Spaeth, Harold J. UNITED STATES SUPREME COURT JUDICIAL DATABASE, 1953-1997 TERMS [Computer file]. 9th ICPSR version. East Lansing, MI: Michigan State University, Dept. of Political Science [producer], 1998. Ann Arbor, MI: Inter-university Consortium for Political and Social Research [distributor], 1999.
Spaeth’s database had everything I would need and much, much more: you could even use it to investigate questions like, which justices tended to vote in concert with which other justices? But, its data only ran up to 1997, so at first I attempted to use SCOTUSBlog’s data to fill in the years 1998–2018. That didn’t work; there were inconsistencies in the numbers of cases recorded in the years in which the two data sources overlapped. (Spaeth records many more decisions each year, even on its coarsest unit of analysis.) So I scrapped the idea of merging the two data sources and slunk back to the clue provided by my blog commenter, leading me to the Washington University Law Library.
A View of the Data
The Washington University Supreme Court Database, it turns out, appears to have been initially seeded by Spaeth’s data (indeed, it makes explicit references to Spaeth to assist anyone comparing the two). But, it spans the years from 1945 through 2018. I’d found my source. The smallest such data set, which counts each Court citation exactly once (multiple memoranda or decisions on the same matter are excluded), includes 8,966 decisions since 1945. Its numbers matched most closely to SCOTUSBlog’s summaries in the years the latter analyzed, but still there were a few more cases in the WU database each year than appeared in the blog’s stat packs.
While I did use SPSS to recode its variables and extract only those I needed, I used Excel for analysis. (Being on sabbatical, my remote connection to university SPSS software is cumbersome. Please poke fun at me in the comments below.)
After coding a variable to register the number of dissenting votes in each case, I focused on the average number of dissents in merit cases each year. Because this average “jitters” frequently on a year-to-year basis, the blue line displayed below is a smoothed four-year moving average taken “backward” (so, e.g., the data point for 2016 is an average of cases in the years 2013 through 2016).

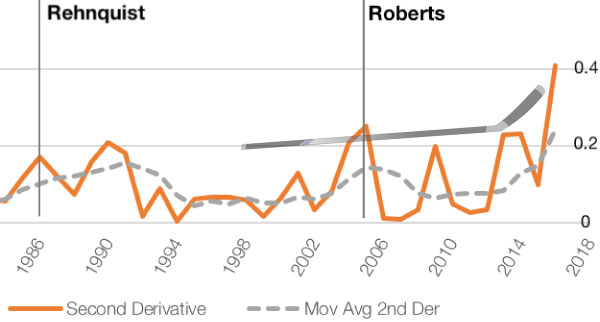
The orange line, plotted on the same scale, depicts the five-point, centered, discrete second derivative of the number of dissents. I say more about this quantity in my preliminary post.
So, what do I make of sixty-plus years’ worth of data?
Analysis
On the question of whether the Roberts court has seen a precedent-breaking increase in dissension, my “Andrew is wrong” diagnosis stands. If anything, the past several years have seen more consensus (a lower average number of dissents per case) than any other period since World War II. This is juiced in part by the surprisingly unanimous term of 2016 in which the Washington University database recorded only three 4-dissent opinions and forty-one unanimous decisions.
The latter represents a difference in how SCOTUSBlog and the WU database record vote tallies. SCOTUSBlog records seven 4-dissent decisions in 2016, by contrast. (I’ve not looked closely enough at the cases themselves to uncover why the sources disagree.) Presumably, the WU database’s methodology remains consistent each year since 1945, so since I’ve not used SCOTUSBlog’s data here, this discrepancy ought not affect the analysis.
A Thirty-Year Boom/Bust Cycle
Far from a sudden increase in dissent, placed in historical context, the Roberts court has so far been marked by a dissension downswing – but one that, if trends continue, is ready to reverse.
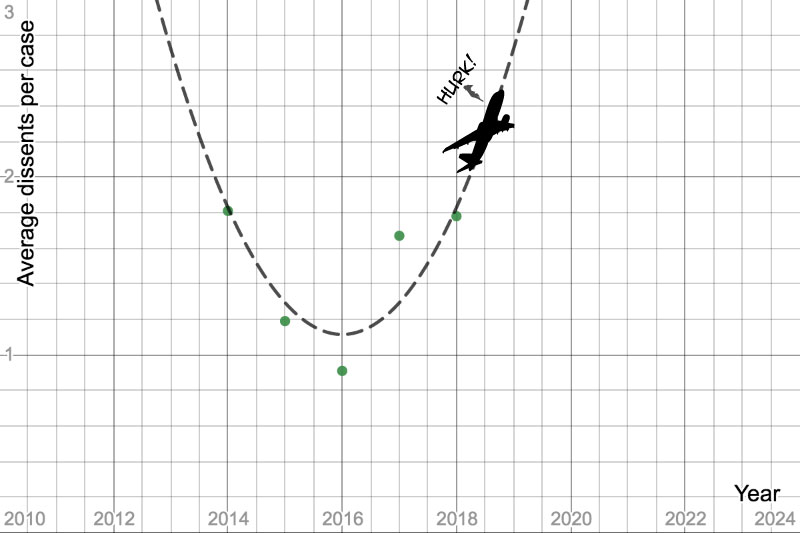
What struck me about the historical record is how consistent the levels of dissent are across these six decades: hovering around an average of 1.6 dissents per case and scarcely wandering further than 0.4 votes away from this mean before reverting back. This reversion has come in a steady cadence, taking about 15 years to oscillate from maximum to minimum and then another 15 back to maximum. Consensus on the Supreme Court appears to ebb and flow in a predictable thirty-year-long oscillation.
I used spectral analysis to quantify this behavior. Since this data appears to begin in 1945 at the top of a crest and end in 2018 at the bottom of a trough, I used the odd-half-integer exponentials [latex]\varphi_k(t)=e^{(k+\frac12)\pi t / 73}[/latex] as a basis for a discrete Fourier transform on the data. This found a modest peak at [latex]k=5[/latex], and taking only this and the constant term ([latex]k=0[/latex]) we obtain the oscillation shown as the dashed cosine curve in the plot:
[latex]d(t) = 1.614 + 0.180 \cos \left( \frac{5.5\pi}{73}t – 1.126 \right)[/latex],
with [latex]t=0[/latex] marking the year 1946. The wave number [latex]k=5[/latex] gives an oscillation with a period of [latex]73/2.25 \approx 32[/latex] years.
If this trend continues, then we would expect to see polarization increase over the next decade as dissension swings back upward from the relative trough in which the Roberts court now finds itself. Thinking about the political moment we appear to be in these days, this feels like a man-bites-dog proposition to me; but, of course, one we would then expect to see begin to reverse sometime in the 2030s.
A second derivative hockey-stick
The one Roberts court trend that was notable in my preliminary post — a sudden uptick in the dissent-over-time second derivative — remains notable even in the longer context of history.
The first derivative (the slope of the blue curve in my chart) measures the direction and rate of change in unanimity: it’s positive when dissent is increasing year-over-year and negative when it’s decreasing. Since the blue curve jitters up and down frequently over the decades, you can convince yourself that this first derivative bounces between positive and negative frequently. There’s not much to note in the trend of the first derivative over time; I don’t see, for example, a sustained period of positive first derivative that would suggest a steady increase in polarization in the Roberts court.
The second derivative, meanwhile, measures what I call the “whiplash effect:” How rapidly are the Supremes changing course on unanimity? To use an airplane metaphor, the second derivative measures the position of their flight stick: pulled way up when it’s positive or pushed way down when it’s negative.
And in the past five years they have yanked that stick further back than any point in the history of this data. Over the last five years the Court has been changing its mind on consensus, turning toward polarization, at a quicker rate than at any point since World War II.
One look at the last five years of data shows what I mean. 2014 was about as polarized (average 1.81 dissents per case) as was 2018 (1.78 dissents per case), but in between there was a precipitous decrease toward consensus (to a historic low point in 2016) and then a rapid rebound. All the passengers on this polarization airplane have spilled their drinks.
Because I used a centered five-point second derivative estimate,
[latex] f^{\prime\prime} (x_i) \approx \frac{1}{12} \bigl( -f(x_{i-2}) + 16f(x_{i-1}) – 30f(x_i) + 16f(x_{i+1})-f(x_{i+2})\bigr)[/latex],
the course change over this five-year period becomes a single data point in the second derivative, attached to the year 2016, the last point on the orange second derivative graph. Note also that the orange curve is the magnitude of the second derivative only; negative signs have been discarded so that only the rate of acceleration is shown and not the direction.
Note that this data has been smoothed in three ways:
- Using a five-point estimate for the second derivative rather than three. This captures a five-year trend in each data point when the minimum necessary is three.
- To reduce noise, I computed the second derivative from the moving averages of the original data, i.e., from the blue curve in the graph, rather than from the one-year-at-a-time averages.
- Finally, the “hockey stick” is most apparent from a further smoothing of this second derivative using a four-year moving average.
Discussion
Andrew was wrong. (There. I just had to say it one last time.) The Roberts Court has not been an era of precedent-breaking polarization in how the Supreme Court justices vote on merit cases. But, if this analysis is to be believed, we are right now at the nadir of a downswing toward unanimity and have begun to rebound toward dissension – snapping back perhaps more rapidly than at any other point in this historical record.
I put more stock in the cyclical oscillation found here – the thirty-year long wave back and forth toward more consensus, then more polarization, and back again – than in the Roberts Court “hockey stick.” For one, the boom-and-bust cycle calculation takes all 60-plus years of data into account, with each year’s average used on its own. It’s global behavior in this data. The “hockey stick” is a local phenomenon, created by only a small handful of data points (namely, the five four-year-moving-averages ending in 2014 through 2018). Because it originated from the moving averages, the year-to-year jitter has been muted — but, whether the increase is statistically significant in the time series is a question I didn’t address. (Nor indeed do I know how to address it, off hand.)
And it is entirely possible, maybe even likely, that the hockey stick is explained not by polarized behavior on the Court but rather on the unusually unanimous years of 2015-2016, two of the most consensual Court terms in this data. Indeed, the levels of dissent in 2014 and 2018 (roughly 1.8 dissents per case) that bracket this five-year period were only slightly above the historical average (about 1.6). So it’s not that the polarization got anomalously high in this period; it’s that, for a brief time, it fell anomalously low.
But this hockey stick does partially scratch my – and maybe Mr. Torrez’s – confirmation bias itch. While the Roberts Court is not significantly more polarized, it appears to be headed in that direction. To mix one last metaphor, if this hockey stick is to be believed, the wheel on the S.S. Dissent has been decisively turned toward polarization in the past several years, and the ship is rapidly listing back away from the consensus of 2015-2016 and toward more dissension.
That “feels right” in today’s hyper-partisan world. But it will take a few more years to know for sure if this change is real or ephemeral.
Acknowledgements and Admissions
My appreciation is due to the Opening Arguments podcast team – Andrew Torrez, Thomas Smith, and their production colleagues – for putting out a terrific show. It’s frequently hilarious, always intellectually honest, and inescapably informative in these tumultuous legal and political times. I’ve always been a math aficionado, but only recently have I caught the law bug, and it was hanging around their podcast that did that for me. Check it out and support their show on Patreon if you are able.
Thanks also to Tom Williams whose comment on my preliminary analysis pointed me to the excellent Washington University database. Not only was it perfect for this work, I’m sure it’d be a great data source for teaching projects suitable for statistics and quantitative literacy courses at any level — particularly for pre-law students, political science majors, or any groups of students interested in trends in the judiciary.
Lastly, it will be evident to any data scientist or statistician that reads these posts that I am neither. So if you’re mortally wounded by my analysis or by any of the choices I made, let me offer my hobbyist’s apology. The great thing about an open, public database like WU’s is that you can download it and do your own analysis too. I hope you’ll share your results with me when you do, either in the comments below or via social media.